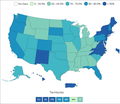
File:USA. Percent of people receiving at least one COVID-19 dose reported to the CDC by state or territory for the total population.png

From Wikiquote
Jump to navigation Jump to search

Original file(1,609 × 1,698 pixels, file size: 215 KB, MIME type: image/png)

This file is from Wikimedia Commons and may be used by other projects. The description on its file description page there is shown below.

This map image could be re-created using vector graphics as an SVG file. This has several advantages; see Commons:Media for cleanup for more information. If an SVG form of this image is available, please upload it and afterwards replace this template with {{vector version available|new image name}}.


It is recommended to name the SVG file “USA. Percent of people receiving at least one COVID-19 dose reported to the CDC by state or territory for the total population.svg”—then the template Vector version available (or Vva) does not need the new image name parameter.

Summary

Description
English: USA. Percent of people receiving at least one COVID-19 vaccine dose reported to the CDC (US Centers for Disease Control and Prevention) by state or territory for the total population of all ages. Hover or click on the states or territories on the map at the CDC source page for more info.

The US territory abbreviations on the map are:

Date 16 August 2021 is the date of the first upload to the Commons. See the file history below for the most recent upload date. Please upload new versions. Use the upload link at the end of the file history list.
Source https://covid.cdc.gov/covid-data-tracker/#vaccinations_vacc-people-onedose-pop-total - You may have to bounce around the sidebar and other links to get to the page with these choices: View: People. Show: At Least One Dose. Population: Total Population. Resulting map will be labeled: "Percent of the Total Population with at Least One Dose Reported to CDC by Jurisdictions and Select Federal Entities".
Author

US Centers for Disease Control and Prevention. After taking a screenshot freeware IrfanView can be used to crop the image, and to add a border: Image menu > add border. Text removed via: Edit menu > Show Paint dialog > Eraser. Text added via: Edit menu > Insert text. For example:

COVID-19 vaccinations. Data as of: May 10, 2023.
Some versions of map: Removed part of the screenshot image, and spliced the remaining parts: Edit menu > remove strip.
Other versions File:US map. Percent of total population of all ages by state or territory who received all doses prescribed by the initial COVID-19 vaccination protocol.png

Licensing

Public domain
This image is a work of the Centers for Disease Control and Prevention, part of the United States Department of Health and Human Services, taken or made as part of an employee's official duties. As a work of the U.S. federal government, the image is in the public domain.

eesti  Deutsch  čeština  español  português  English  français  Nederlands  polski  slovenščina  suomi  македонски  українська  日本語  中文(简体)‎  中文(繁體)‎  العربية  +/−

Captions

US map. Percent of people receiving at least one COVID-19 dose reported to the CDC by state or territory for the total population

Items portrayed in this file

depicts

16 August 2021

image/png

File history

Click on a date/time to view the file as it appeared at that time.

(newest | oldest) View (newer 10 | ) (10 | 20 | 50 | 100 | 250 | 500)
Date/TimeThumbnailDimensionsUserComment
current16:33, 20 May 2023Thumbnail for version as of 16:33, 20 May 20231,609 × 1,698 (215 KB)TimeshifterLatest
16:30, 12 December 2022Thumbnail for version as of 16:30, 12 December 20221,239 × 1,069 (138 KB)TimeshifterLatest map from source.
04:25, 13 June 2022Thumbnail for version as of 04:25, 13 June 20221,228 × 1,014 (163 KB)TimeshifterLatest map from source.
03:05, 27 April 2022Thumbnail for version as of 03:05, 27 April 20221,106 × 994 (144 KB)TimeshifterLatest map from source.
19:00, 29 March 2022Thumbnail for version as of 19:00, 29 March 20221,819 × 1,476 (340 KB)Timeshifterlatest map from source.
02:59, 23 February 2022Thumbnail for version as of 02:59, 23 February 20221,731 × 1,418 (317 KB)TimeshifterLatest map from source
20:38, 8 February 2022Thumbnail for version as of 20:38, 8 February 20221,765 × 1,441 (333 KB)TimeshifterLatest map from source.
23:33, 12 January 2022Thumbnail for version as of 23:33, 12 January 20221,581 × 1,285 (276 KB)TimeshifterLatest map from source.
21:31, 28 December 2021Thumbnail for version as of 21:31, 28 December 20211,574 × 1,297 (211 KB)TimeshifterLatest map from source.
08:48, 15 December 2021Thumbnail for version as of 08:48, 15 December 20211,589 × 1,288 (212 KB)TimeshifterLatest map from source
(newest | oldest) View (newer 10 | ) (10 | 20 | 50 | 100 | 250 | 500)

The following page uses this file:

Global file usage